

Problem
Collaborative math is hard to see
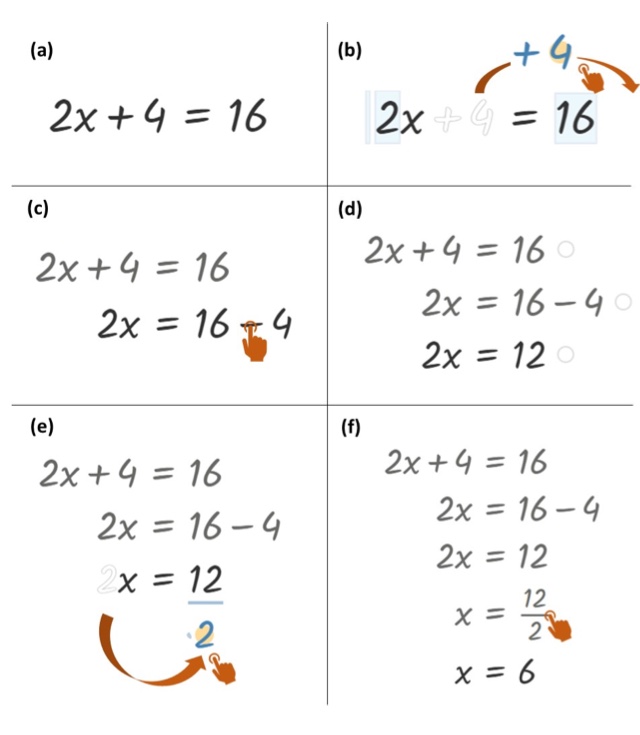
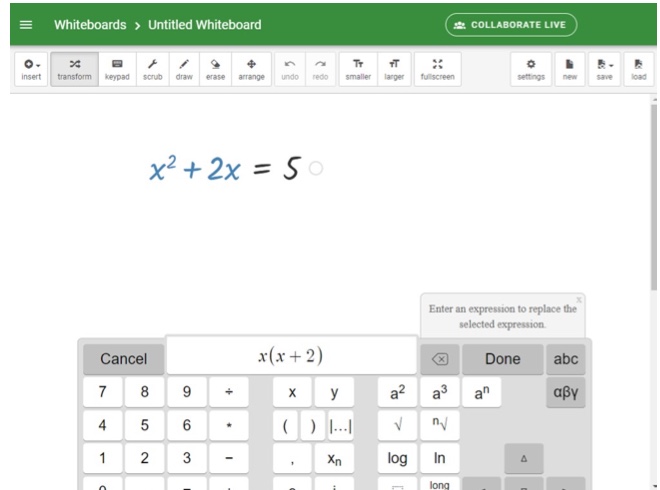
Graspable Math turns algebra into objects you can move: drag the +4 across the equals sign and it becomes −4; drag the 2 away from x and it divides the other side. Its new collaborative whiteboard lets two students work on the same equations at once, like a shared doc, and logs every move.
Collaboration is routine in writing tools and rare in math, so nobody yet knew what it looks like in the data. And a teacher with 30 students cannot watch every pair. What should a dashboard show her?
Study 1
Study 1: what 448,000 logged actions say about how pairs work
I analyzed 448,025 logged actions and focused on the 504 whiteboards shared by exactly two students (736 students). Sessions ran from minutes to hours, so I normalized each into 12 equal time segments, extracted more than 785 time-series features, reduced them with PCA, and clustered pairs within groups of similar session length.
- Slow build, fast startSome pairs warm up to collaboration; others engage from the first minute.
- Role swapOne student leads early, then the other takes over.
- In sync or lopsidedSome pairs move together; in others, one student does nearly all the work.
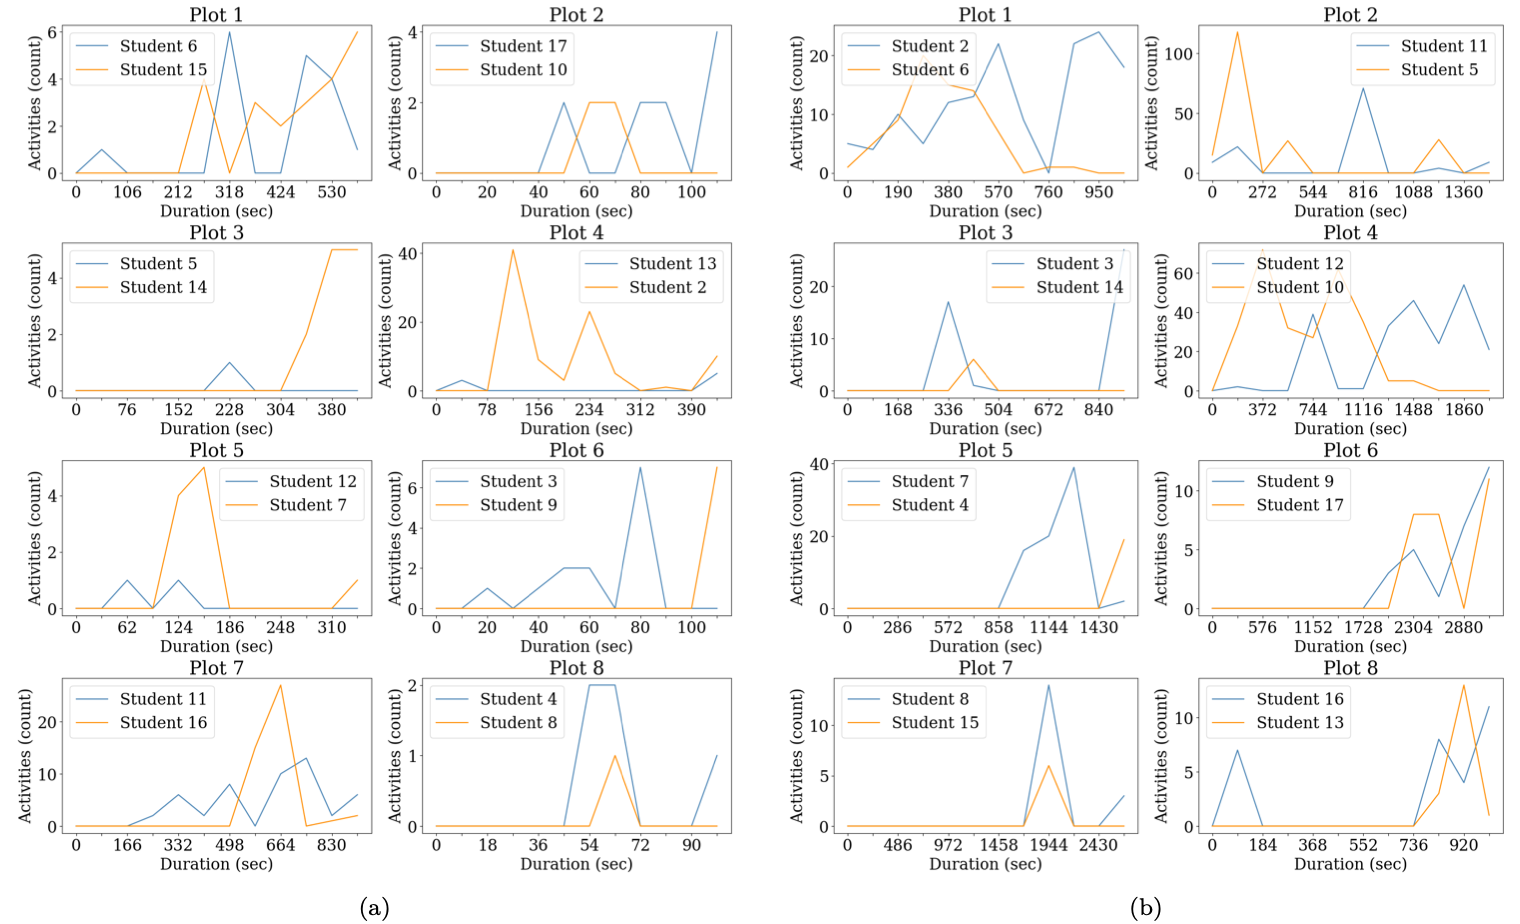
An honest note: clusters at the individual level were too noisy to interpret. Segmenting by session length is what made the patterns legible.
The patterns were real. The open question was whether a teacher could use them.
Study 2
Study 2: we showed a teacher the chart
Two researchers spent a week in a 6th-grade classroom (43 students) running collaborative activities with the teacher. Our first co-design question, “What superpowers would you want?”, fell flat: she mostly praised the activity. Reframing it as a ranking surfaced her priorities: combined work first, then higher-level thinking, engagement, and feedback.
Then we showed her a chart from Study 1 and asked what she learned and what she would do. Try it yourself:
Design
Add an AI layer that reads the log for her
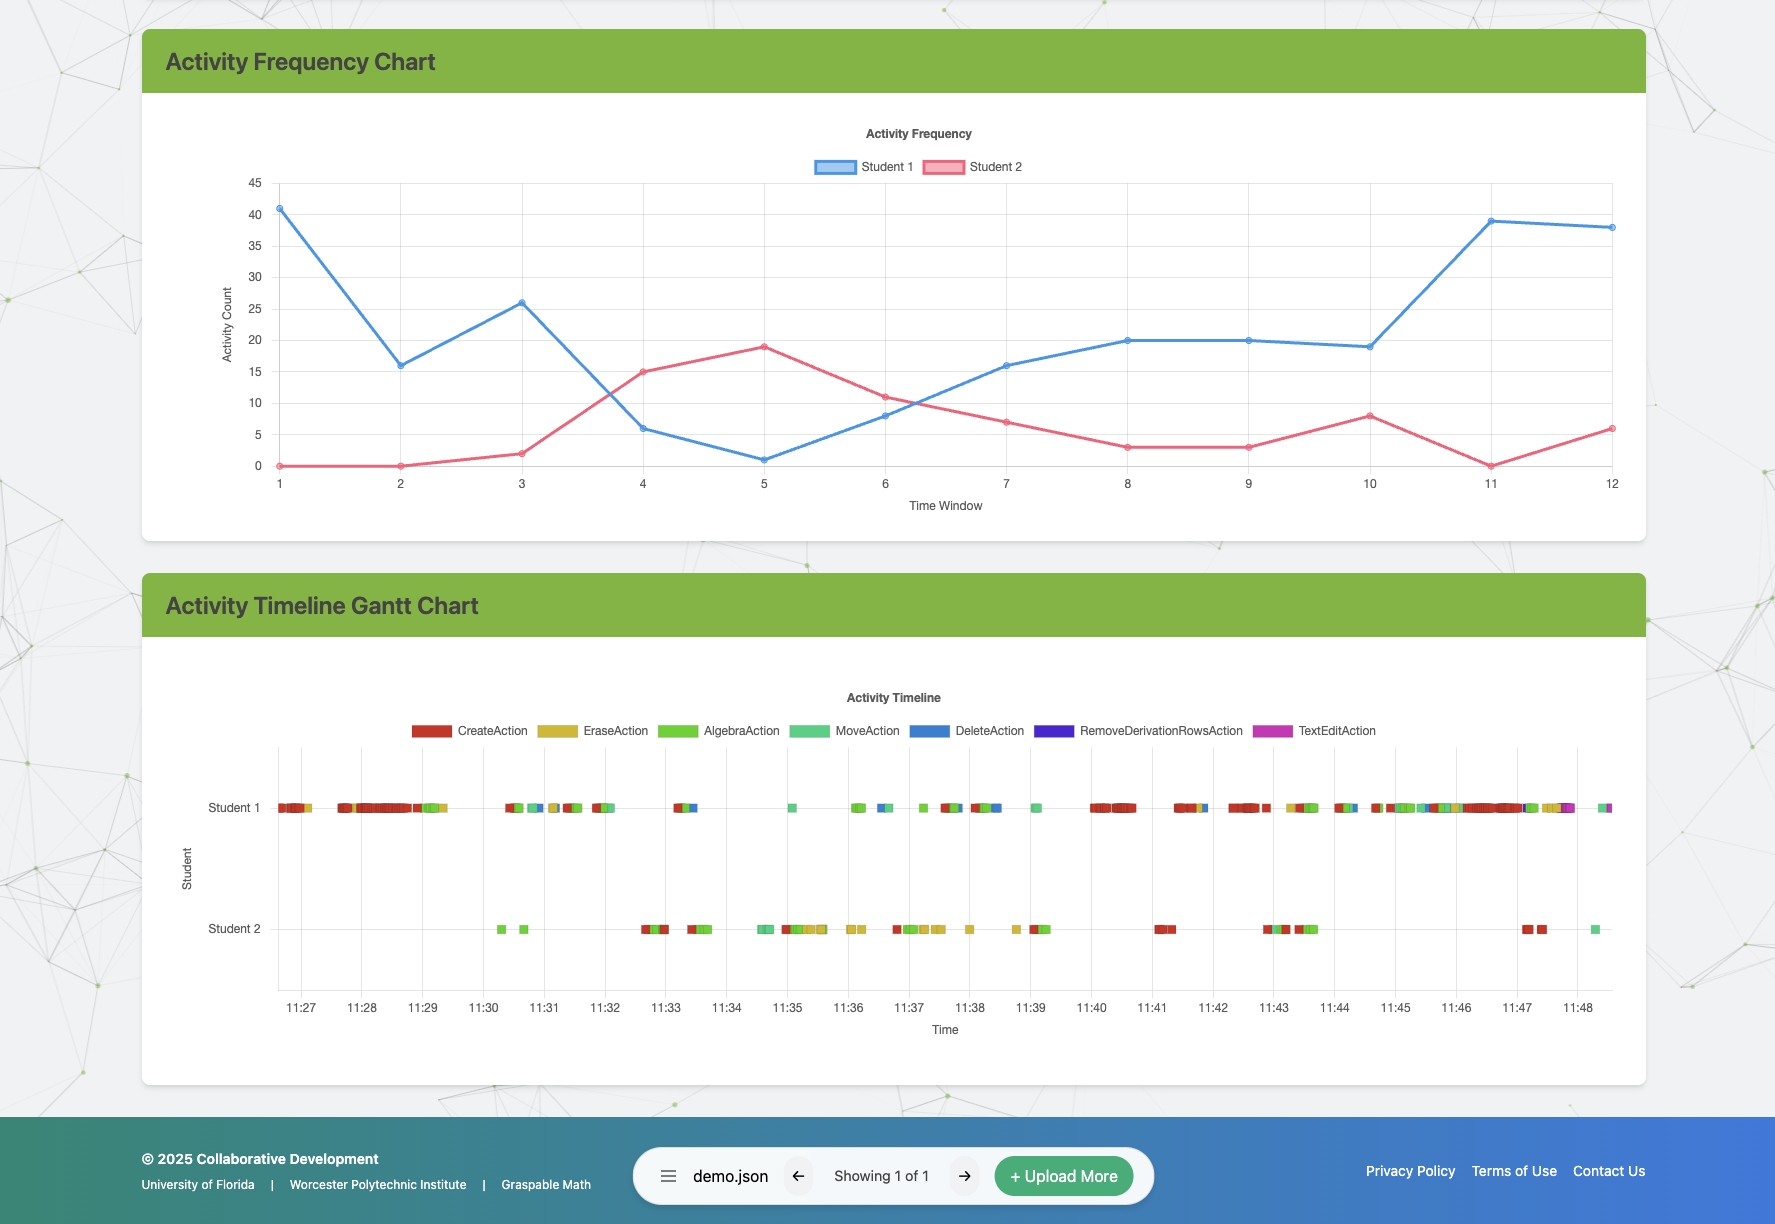
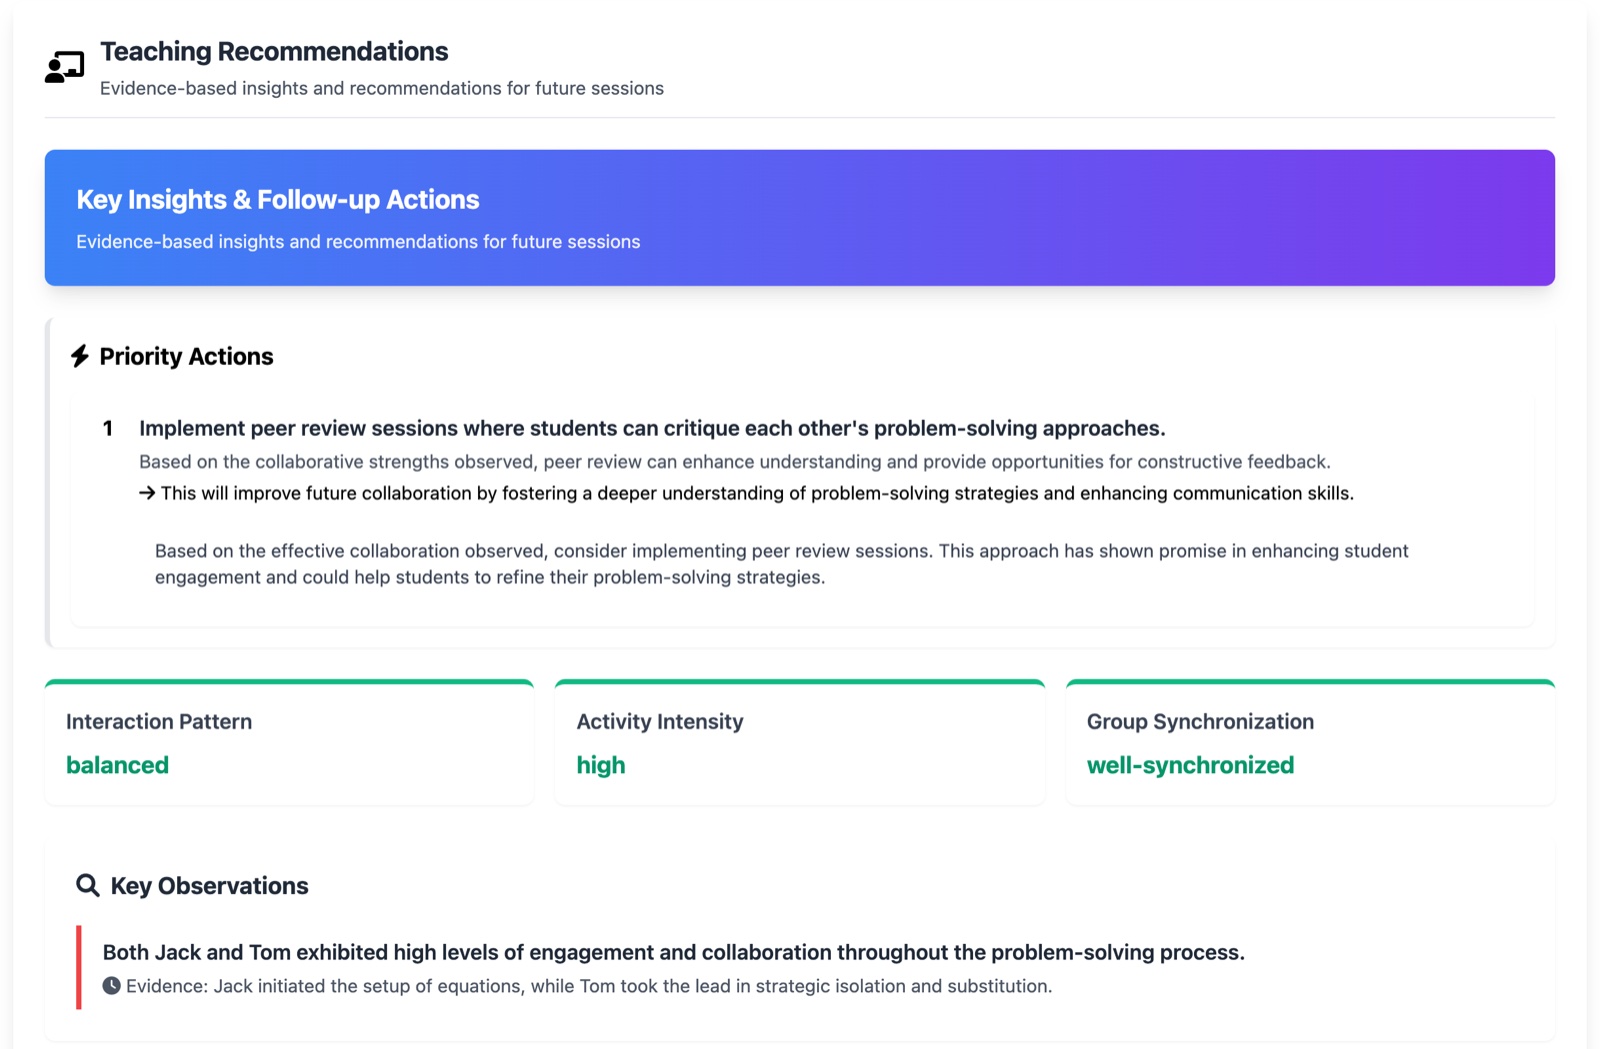
The charts stayed, because they show a whole session at a glance. On top of them we added an AI analysis the teacher can run on any session. It reads the action log and writes three things: how the pair worked together, the moments that may need her (a breakthrough, a struggle, a partner who went quiet), and a recommendation for next time, each with the evidence behind it. For follow-up questions there is a chat about that session, with suggested questions so she never starts from a blank box.
- Proactive, not on-demandThe analysis arrives without the teacher having to ask. The chat is there for when she wants more.
- Every student appearsThe analysis must mention every active student in its key moments, so a summary never describes only the louder partner.
- Uncertainty stays visibleWhen the evidence is ambiguous, the summary offers more than one interpretation, and the panel says plainly that the AI can be wrong.
- Logs, not camerasEverything comes from action logs, with no audio or video of children.
How it works
Keeping the AI close to the log
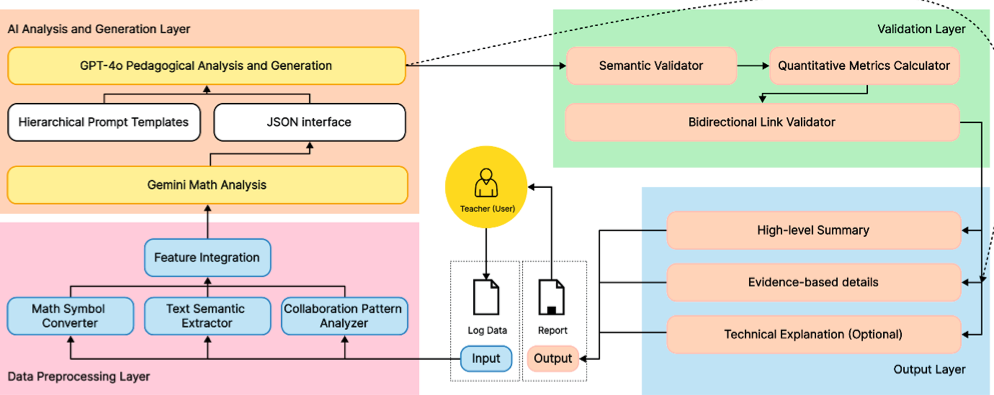
A raw session log is long and noisy. A preprocessing layer cuts it by 70–80% while keeping each reasoning step, so a sequence like 2x + 3 = 7 → 2x = 4 → x = 2 survives intact. One model analyzes the mathematics, a second turns that analysis into language for teachers, and a validation layer scores each report and reruns weak ones before anything is shown.
Impact
From a research pipeline to a tool anyone can try
The dashboard is public with anonymized demo data at gmdashboard.viablelab.org. The work produced a first-author EDM 2024 paper and an AIED 2025 paper (acceptance under 16%), with partners at Graspable Math and Worcester Polytechnic Institute.
One teacher is a partnership, not a sample, and the AI layer still needs the validation we called for in the paper. While preparing this page I ran the same demo session twice: one report called the pair “partially synchronized,” the next “well-synchronized.” Next I would measure that consistency directly, check reports against human coders, and run a classroom study with several teachers comparing their decisions with and without the summaries.