Closed-source: usable ranking
gpt-5-mini reached AUC 0.69 and gemini-3-flash 0.67, moderate and good enough to help prioritize items for human review.


AIED 2026 · Long Paper · Seoul
When a language model codes a student’s message and reports “confidence: 0.9,” can we believe it? Across three studies on 633 expert-coded student–AI dialogues, all three models we tested were consistently overconfident. We then look at why prompting struggles to fix this, a pattern we call plausibility-gated anchoring, and explore whether adjusting a model’s internal activations can help its confidence track correctness a little better.
LLMs are becoming everyday tools for qualitative coding in educational research. They scale, they stay consistent, and they reduce human labor. But one basic question shapes how far we can rely on them. When can an AI-generated code be trusted? Traditional classifiers emit calibrated probabilities. LLMs do not. They write a number as just another token, without direct access to their own internal state.
We use 633 student prompts submitted to ChatGPT in a graduate introductory CS course, independently coded by two expert qualitative researchers into nine mutually exclusive categories (Cohen’s κ from 0.65 to 0.94). Every model receives the same prompt. It predicts a category, reports a confidence from 0 to 1, and gives a brief rationale, which is how practitioners often elicit confidence in practice.
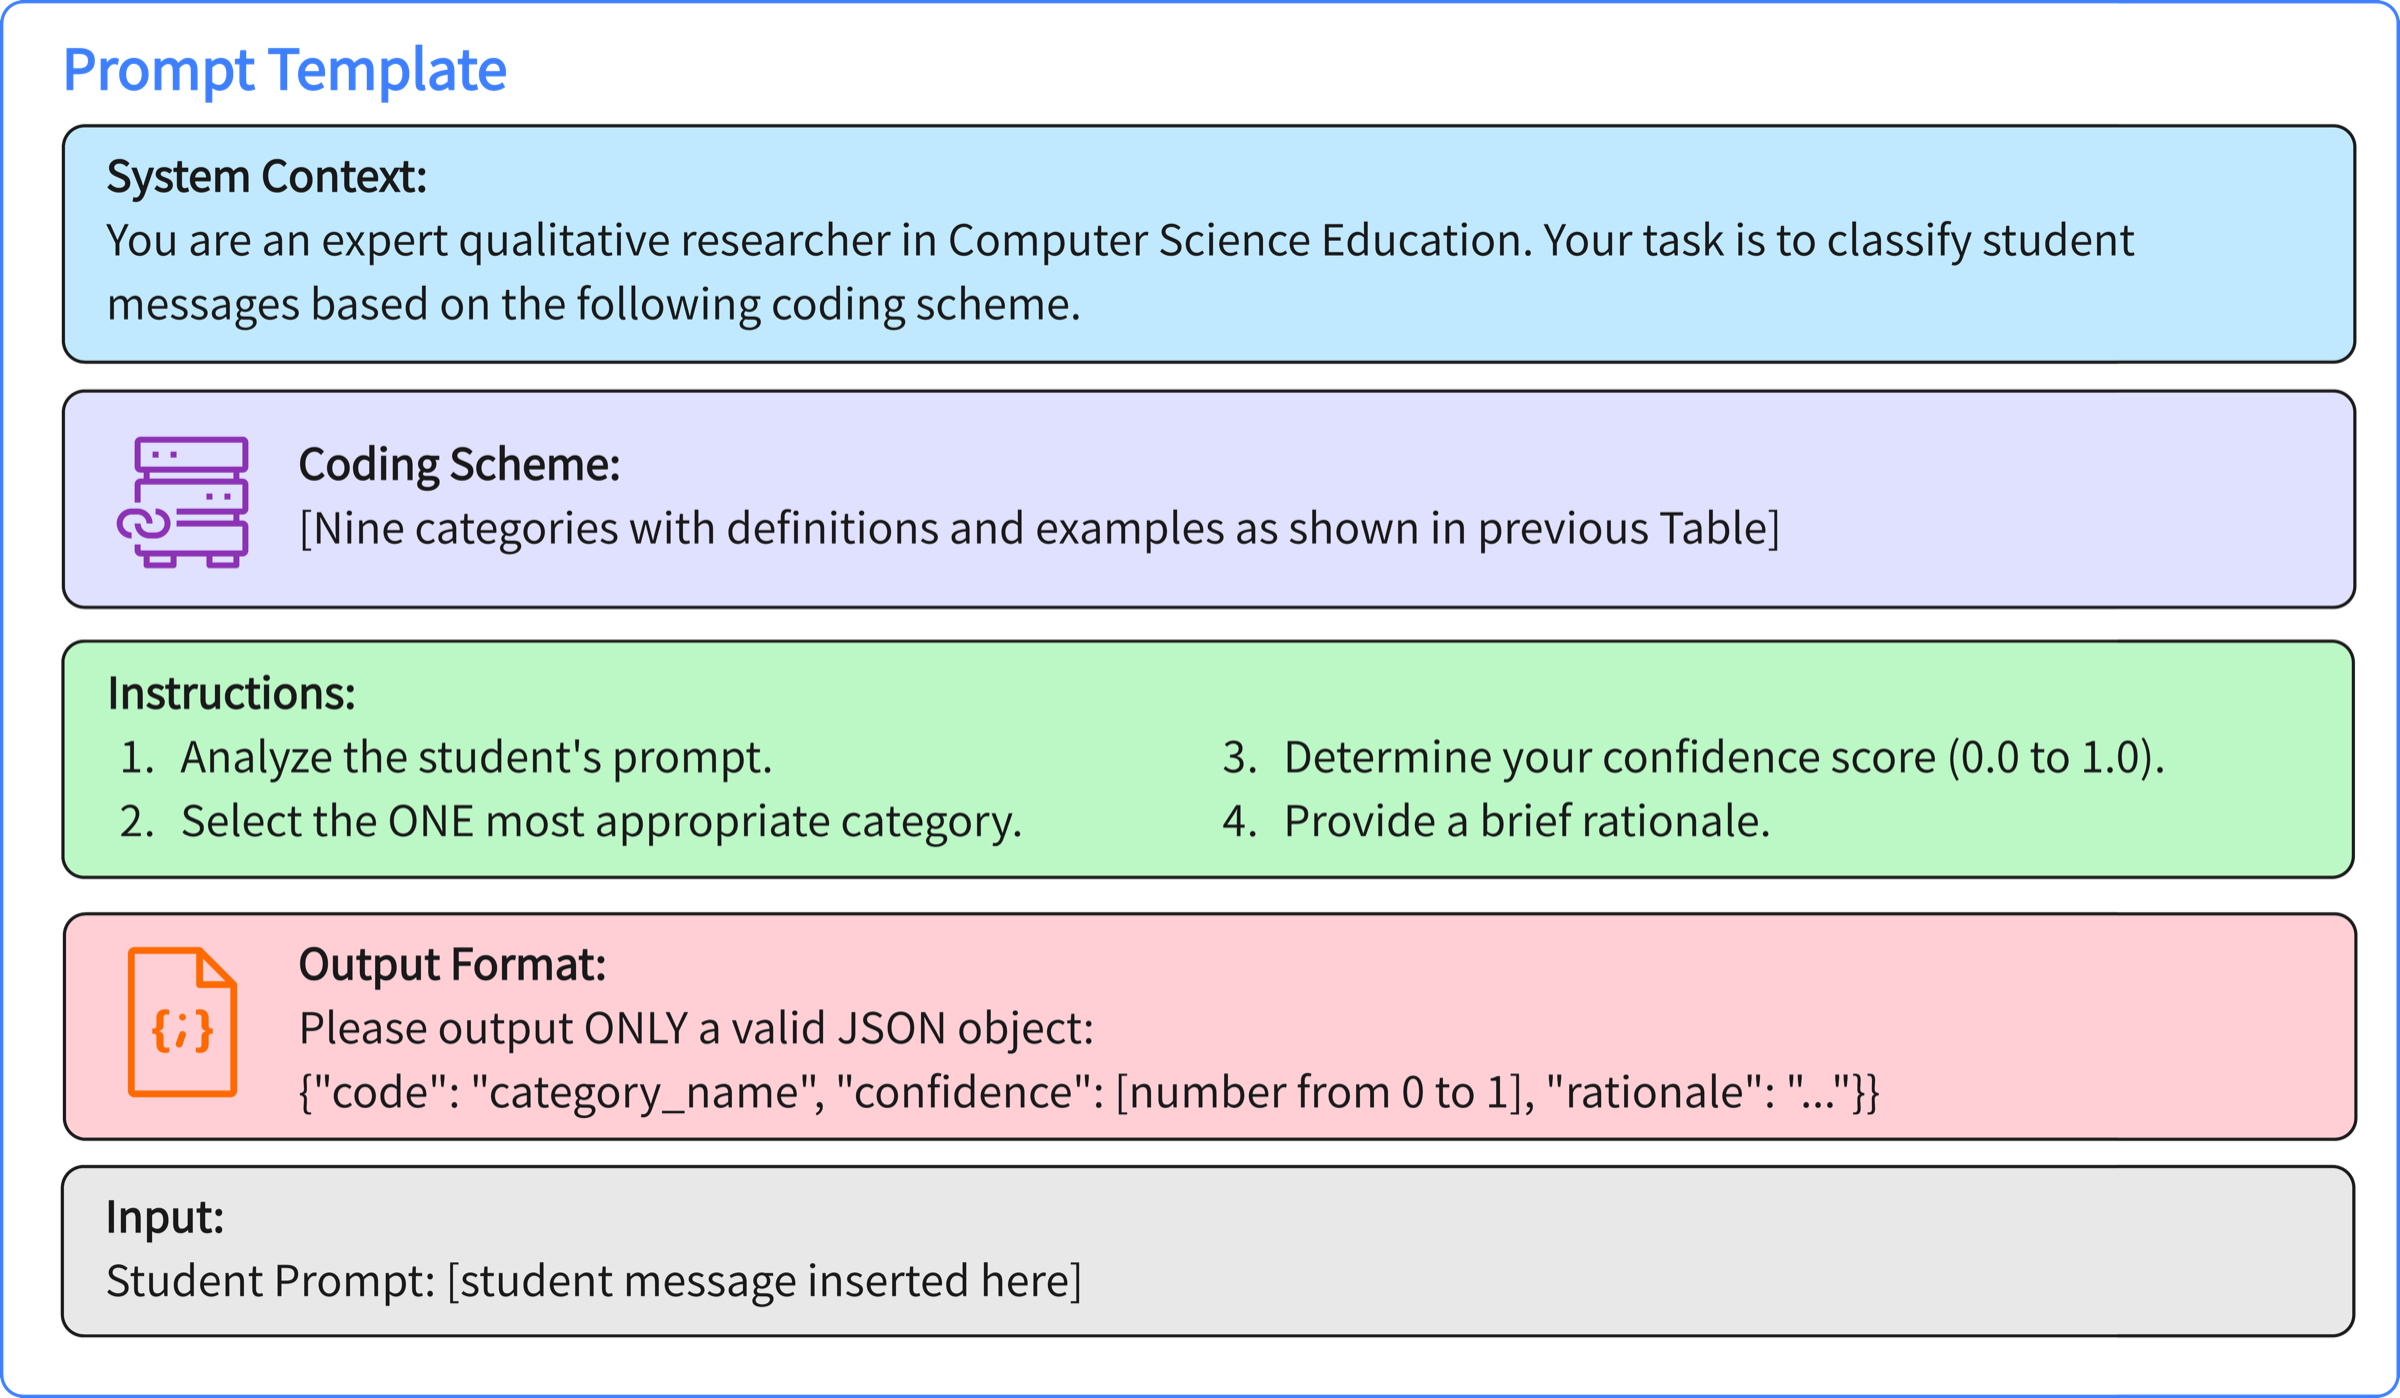
We evaluate three models across the accessibility spectrum. gpt-5-mini and gemini-3-flash-preview are commercial APIs, and llama-3.1-8b-instruct is open-weight and run locally. We measure calibration with three metrics, ECE, AUC, and Spearman’s ρ, which separate how overconfident a model is from how well it ranks its own correctness. Runs use greedy decoding for reproducibility.
All three models reported mean confidence between 0.89 and 0.92 while being correct only 34% to 52% of the time, leaving confidence–accuracy gaps of 0.40 to 0.55. Nine-way coding over semantically overlapping categories is genuinely hard, and chance is about 0.11. The more useful story is in discrimination, whether higher confidence at least means more likely correct.
gpt-5-mini reached AUC 0.69 and gemini-3-flash 0.67, moderate and good enough to help prioritize items for human review.
llama-3.1-8b reached AUC 0.57, so confidence-based triage offers limited value over random ordering.
gemini was the most accurate model yet ranked its correctness slightly worse than gpt-5-mini. Knowing the answer and knowing when you know it look like different abilities.
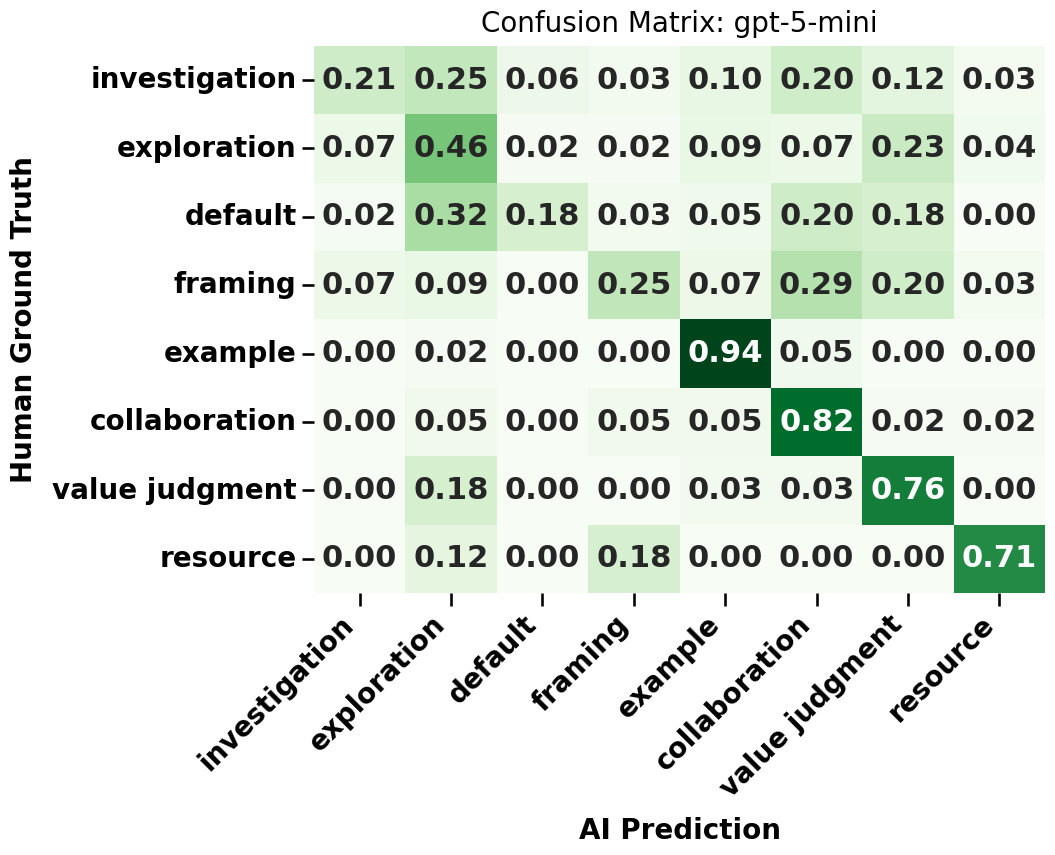
The confusion matrices below show where each model concentrates its predictions and which categories it tends to conflate.
Scope. One dataset and one coding scheme. These specific values may not transfer to other domains or to coding schemes of different granularity.
Browse the per-model confusion matrices and the anchoring density plot from Study 2.
Why can we not just tell the model to be less confident? We tried, by changing the example confidence shown in the prompt’s format spec. The result was notably asymmetric.
96.5% of outputs landed at exactly 0.95. Variance dropped sharply (kurtosis 37.7), and discrimination got a little worse, as the spread that carried the signal narrowed.
Zero outputs adopted 0.05. The distribution returned to its default high-confidence range (around 0.80 to 0.95).
The model tends to adopt a shown value only when it falls inside a range it already treats as plausible for the task. Anchoring here is not symmetric, it appears filtered through a learned prior. One reading is that verbalized confidence reproduces what confident classification text looks like more than it estimates uncertainty, which would help explain why demonstrating low-confidence examples, on its own, does not recalibrate the model.
Scope. This anchoring analysis is on the open-weight model. We did not test whether larger open models share the same plausibility range.
If prompting is limited by the prior, can we work a level below it? Using representation engineering, we recorded activations from one middle layer on all 633 samples, grouped them into well- and poorly-calibrated sets, and took the difference of their mean activations as a single direction inside the model. Adding a small multiple of that direction back during inference nudges the model toward better-calibrated behavior, with no retraining.
AUC moved from about 0.565 to 0.585 in both settings we tried. Spearman’s ρ rose from about 0.13 to 0.16, a small absolute change that looks larger in relative terms because the base is low.
The direction was built on one half of the data and measured on the other half, so the gains are not simply fitting the training split.
The overconfidence gap stays large. This shifts the ordering of confidence slightly, it does not turn the number into a probability.
A cautious reading is that some calibration-relevant signal sits in the representations and can be partly surfaced without retraining, as a complement to prompt-based strategies rather than a replacement.
Scope. The gains are modest and evaluated within a single dataset. We have not yet confirmed them across other datasets or larger models.
Around AUC 0.68, directing review toward low-confidence items can help. Near 0.56 it offers little, so check the discrimination on your own data before relying on it.
With ECE above 0.40, a reported 0.9 is not a 90% chance of being right. Confidence is safer for ordering items than for setting acceptance thresholds.
A shown value tended to either collapse the distribution or be ignored, so fixing explicit confidences in few-shot examples can quietly affect calibration.
For FERPA-bound local deployments, activation steering is one approach that gave small gains here. Our implementation is open if you would like to try it.
The talk follows the same arc as the paper. It opens with the trust problem, walks through three studies that build on one another, and closes with what this changes for anyone using LLMs to code educational data.
We want to be clear about scope. This is a single dataset of introductory CS prompts with one nine-category scheme, so the specific numbers may not transfer to other domains or granularities. Studies 2 and 3 use one open-weight model, and larger models may shift where the plausibility range sits. The steering gains are modest and evaluated within one dataset, so we present them as a promising direction rather than a settled result. We also used single-turn, zero-shot prompting.
The natural next steps are per-category calibration, larger models, richer elicitation such as multi-turn or chain-of-thought, and replication across datasets. Per-category metrics interest us most, since they would tell researchers which codes are reasonable to automate and which still need a person.